What is technical analysis?
Technical analysis is a set of visual charting tools and statistical methods for price pattern and trend recognition used to predict stock and financial markets, find opportunities, and support trading decisions.
When we say that technical analysis is a “set,” we imply that technical analysis as a discipline is not cohesive.
- It is not truly a theory.
- It is not a science.
It is an eclectic collection of empirical methods, approaches, “theories”, and ways of forecasting prices using the price itself, or more precisely, its past history. Often, other market indicators are added to this, such as trading volume or order imbalance.
Fundamental vs Technical

Unlike fundamental analysis, technical analysis is interested in the behavior of groups of people (especially the crowd), whose collective actions it tries to understand and predict based on price changes as a proxy for their behavior. This is often not stated directly, as the focus is on the “behavior” of the price (or its analytical derivatives, such as indicators), but it is always implied that its movements are driven by the decisions of people, especially large groups (the crowd), particularly when they exhibit herd behavior.
Fundamental analysis is not concerned with people’s opinions (as expressed through price) but attempts to analyze the intrinsic value of the underlying entity (such as a company or a state). This is associated with a well-known contradiction: fundamental analysis speaks of how things should be, while technical analysis shows how things are. Often, the market (i.e., its participants) ignores fundamental analysis.
Evolution and Revolution
The evolution of technical analysis as a discipline spans at least 100 years and has historically been very diverse.
The simplest early method of technical analysis is tape reading. Essentially, it involves reading basic market information (price, trading volumes) and mentally analyzing their changes to predict the behavior of other players based on general considerations, their perceptions, and personal experience.
Charting
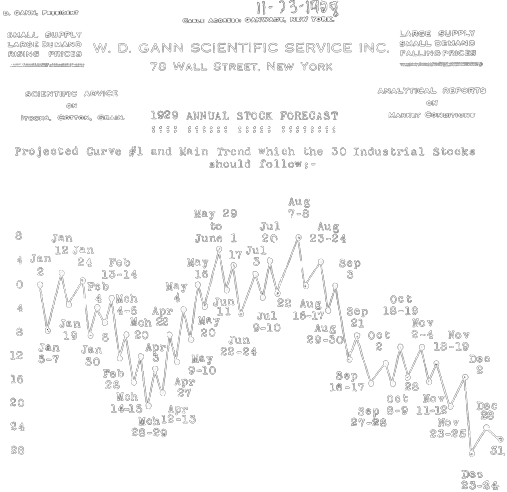
The revolution in technical analysis came with charting. The ability to draw a chart instead of keeping everything in mind gave a significant boost to innovations in this field, many of which appear quite controversial, leading technical analysis skeptics to often compare it to astrology.
From a certain perspective, technical analysis (TA) can be seen as data mining, a discipline focused on extracting information from noisy raw data (prices). In this sense, attempts to eliminate noise and reveal hidden trends include methods of chart construction such as Candlestick, Bar, Point & Figure charts and etc. Another way to reduce noise is by smoothing the price using moving averages and their combinations.
As innovations in TA attracted the attention of both investors and charlatans, tens of thousands of books have been written on how to correctly draw trend lines, support and resistance levels, smooth prices, and so on. Most of these books are useless and written solely for commercial gain in the writing business.
Indicators
The next stage in the development of TA was a new level of information processing in the form of simple (by today’s standards) statistical and mathematical transformations of the price series – these are what we refer to as “indicators.”
Indicators allow us to uncover local aspects of price behavior that are not easily noticeable “by eye.” For example, the RSI indicator shows the monotony (“non-corrective”) movement of the price in one direction (without corrections), while MACD indicates its speed. The latter is associated with the emergence of the next layer in the evolution of TA – divergences. Divergences are visual discrepancies between local price extremes and another data series (most often an indicator based on the price). The interpretation of such a divergence in the case of MACD (just an example) is a slower rate of price change approaching the next local extreme, which can be interpreted as a “weakening” trend.
Computers
The development of computer technology is closely linked with innovations in technical analysis. The availability of personal computers (and technical analysis software) led to a boom in “indicator building” and, as with graphical analysis, attracted the attention of many dubious authors and inventors.
As computing power has developed, the algorithmic approach has flourished, which can also be considered a form of TA innovation. Despite the increased capabilities, technical analysis for many has remained at the level it reached in the second half of the last century, only in a more glamorous package.
Correlations
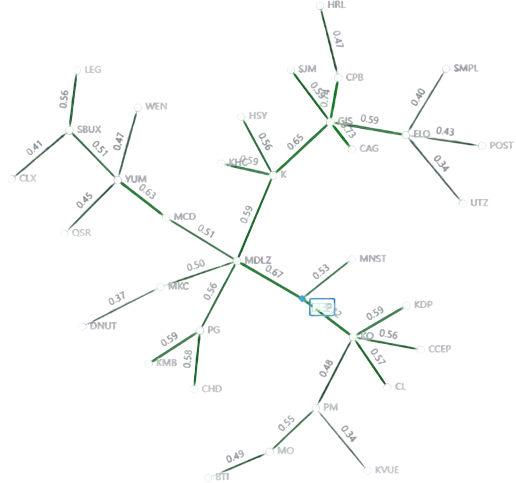
Stocks, currencies, and indices no longer exist in isolation; they influence each other. This influence (correlation) makes it difficult to understand what is happening with a specific instrument and where it is headed. The idea is to remove external influencing factors from the price (ideally all, but at least the most significant ones) and make trading decisions based on the “clean” price, applying classical technical analysis or other well-known methods—a key innovation in technical analysis offered by https://darktrend.com. In fact, DarkTrend reinvents technical analysis using modern data mining and statistical methods.
The content and materials provided are not intended as, and should not be taken as, financial, investment, trading, or any other form of advice, nor as recommendations that have been confirmed or supported by DarkTrend or its affiliates. For more details, please refer to the Terms of Use