The Art and Illusion of Technical Analysis in Trading
The proliferation of retail platforms - those digital canvases for charting lines, squares, triangles, and loud proclamations over price charts-has turned technical analysis into a peculiar form of art: charting.
Meaningless and merciless, it has captivated the hearts and souls of retail investors, who draw lines upon lines, filling social media feeds, even lifestyle Instagrams, with their creations. 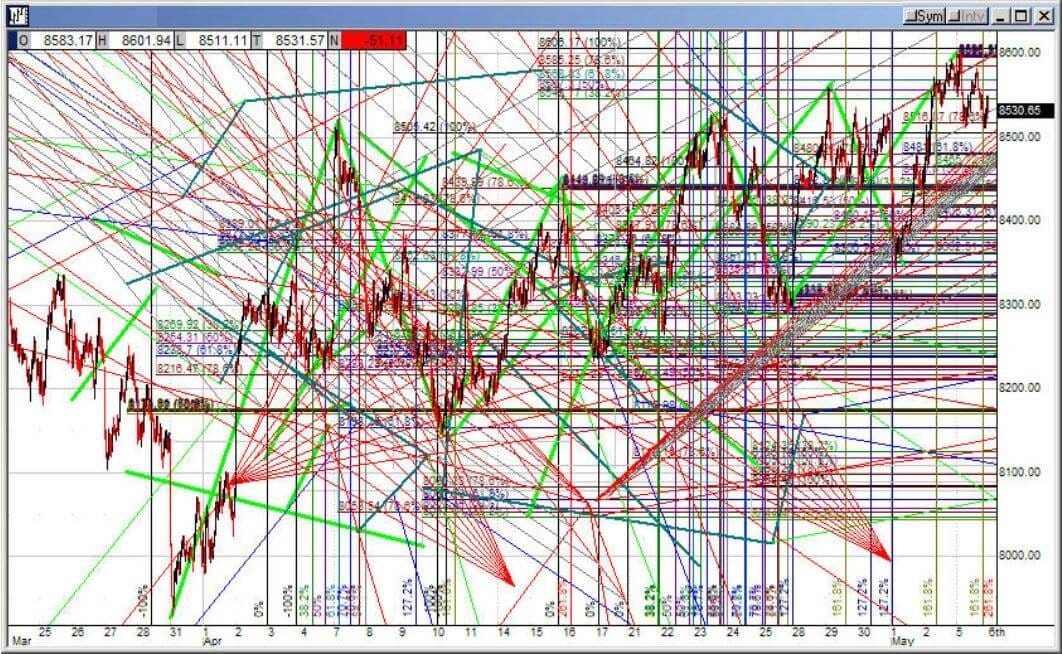
Today, this is what we call technical analysis.
The visual appeal is understandable. Sharp lines resemble blueprints, and blueprints signify engineering precision and predictability. Indeed, this is exactly what everyone who trades in the market covets.
“Trading plan,” “discipline,"-these are the words we hear from influencers who cater to retail investors. They give hope that diligent, consistent, and disciplined work will bear fruit.
And it indeed “will” yield results, but only if the investor buys slightly more often than they sell during a bullish market trend.
However, when comparing such an investor’s track record with the S&P 500 index, considering all risks, leverage, drawdowns, anti-diversification, commissions, DCF, and martingale strategies’ tail risks, it becomes clear that investing in SPY might be the best choice-perhaps even for professional investors (often institutional ones), who are hunting for “alpha” (and rarely find it, as it is the market’s gold).
Numerous (of course, successful) tutors, coaches, and the likes of Robert Kiyosaki tell us that one simply needs to try harder, watch the screen more, and draw charts. Be disciplined. This gives hope… and increases the audience of industry influencers’ YouTube channels.
We will share the most crucial information that you need to know-the things they won’t tell you in beginner guides.
Fuzzy Trends
Do not be fooled by the seemingly precise beauty of charts with their strict, straight lines.
Technical analysis is, at its core, an imprecise and fuzzy craft-fuzzy in the most literal sense. Tiny deviations in High and Low prices from different data providers could shift take-profit and stop-loss levels by ±10%. Moreover, a mere few pixels’ difference on various computer screens could alter the chart, adding another ±5% of inaccuracy.
Interestingly, the smaller the observation interval, the less noticeable this effect becomes (good news for brokerage companies).
Therefore, intraday trading largely deals with trading noise, making discussions around technical analysis in this context somewhat tricky…
Picture this: a year ago, an overly zealous market participant influenced the daily maximum or minimum by executing an excessively aggressive order, adding a mere 0.25% to the current extreme. Because of this, a year or two later, the trend line could shift by several percentage points. How many such instances have occurred?
Seasoned chartists know that charts can look different across various platforms…
… and this is why it’s crucial to let positions “breathe.”
Trend lines should serve only as rough guides, except in rare cases of ATM-level breakthroughs, where a definitive event immediately attracts new participants, who jump into the game. A trend line breakout is an ambiguous event, spread across a wide range of levels-it’s not even an event in the true sense.
As we mentioned earlier, different platforms, systems, and price sources (sometimes even the rounding of prices matters) will produce different trend lines. In the end, they form a kind of “broad” band that might suggest something is shifting, but never offer a precise level. Always keep this in mind.
Innovations in Technical Analysis: A Modern Reflection
Technical analysis (TA) as we know it today began in an era when most traders simply watched prices without truly seeing them-no drawing, no trend spotting, no tendency identification. Those few who did harness the power of chart drawing gained a significant advantage.
Fast forward to now: just drawing charts isn’t innovative anymore. The market’s perpetual rhythm ensures that innovations offer an edge only to early adopters, soon becoming commonplace and losing their unique advantage. Hence, it is imperative to continually seek new methods to discern trends and process data.
The history of technical analysis is marked by various waves of innovation. Moving averages and diverse smoothing techniques set the stage.
We saw the rise of undervalued presentation methods like Point & Figure charts and the advent of complex indicators for data visualization and processing.
Many past innovations no longer hold sway today but once provided a decisive edge in trading.
In our current landscape, a standout innovation in technical analysis is the extraction of hidden trends from prices based on external correlations-a concept brought to life by DarkTrend.com.
Moreover, the democratization of algorithmic trading has made significant strides, exemplified by both triumphs like Jared Broad’s QuantConnect and setbacks such as John Fawcett’s Quantopian. The market for TA innovations remains densely packed, making the search for that elusive golden nugget ever so challenging. Yet, this cluttered pursuit has always been the norm, driven by the restless ambition to match the laurels of legends like WD Gann, Thomas DeMark, and Ralph Nelson Elliott.
Consequently, there has never been a shortage of new “principles,” “charts,” and “secret indicators.”
Correlations: The Hidden Symphony of the Market
Over decades in the investment industry, one startling revelation stands out: even seasoned traders often misunderstand correlation and its significance. Imagine stock A is strongly correlated with stocks B and C. Let’s bypass the complex calculations and the eternal “correlation vs. causality” debate.
Picture yourself as a masterful technical analyst. You’ve meticulously charted the trend lines, support, and resistance levels for stocks A, B, and C. Based on this data, you’ve set your trading orders, stop-losses, and more. But here’s the twist: What are you truly trading?
When you trade stock A, you’re essentially playing a symphony of trends from not just A, but also the orchestrated influences of B and C. Did your order on A succeed due to its own performance, or was it dragged by the currents of B and C? The waters are muddy, the analysis convoluted, and it’s uncertain which instrument truly governs your decisions. Chaos reigns supreme.
Historically, correlations, especially intraday and high-frequency ones, were less pronounced. Today, every instrument is a node in a vast web of influences, each contributing to a cacophony of cross-noise. This interconnectedness stems from the democratization and globalization of finance.
What if we could strip away the mutual influences of these instruments and examine their “pure” (idiosyncratic, as termed in academia) price dynamics? This concept birthed DarkTrend.com. Our FAQ details how we unveil hidden trends for subsequent traditional technical analysis using machine learning, advanced mathematics, and a sprinkle of AI. We believe this represents a profound, fundamental innovation in our field. Remember, always be mindful of the correlations between instruments-indices, stocks, futures, ETFs, cryptocurrencies, forex pairs, and more. Is your stock plummeting due to the company’s failing fortunes and bleak sales forecasts, or is it simply being swept along with the S&P 500’s decline? Should you sell at the break of a downtrend, knowing it’s not an issue of your specific instrument but a broader market movement? Your bet was on the stock, not the index.
Discipline
Markets can be thrilling. Unfortunately, this excitement isn’t always from profits. Advocates of technical analysis often tout the elimination of excitement as a benefit, usually couched in terms like “discipline” or “trading plan.” But this is a trap. In what way is it better to lose your money-coldly or emotionally? If the choice is truly about how to lose, then it is rational to prefer doing it while keeping one’s nerves intact. But can this really be called the path to successful investing?
The truth remains: if you do not understand the market well, technical analysis merely makes it more comfortable to lose money. Without innovative ideas, experience, and competitive edges, it provides no advantage. What technical analysis has become today among the masses is just an old, well-worn method of worrying less. But no more than that, plus the aesthetic pleasure of drawing straight lines.
Screening Options
Not everyone grasps that a successful trading strategy hinges on diversification. This term, so often bandied about, has been relegated to the realm of academic pedantry. Yet, my focus here is slightly different. You must actively sift through a myriad of instruments, hunting for investment opportunities. This concept, while not directly tied to technical analysis, is integral to its framework. If you’re immersed in technical analysis, don’t get bogged down with a single instrument. Be swift and efficient in screening various options, generating numerous simultaneous trades-each relatively small in proportion to your capital. It may not have the bravado of “I’ll buy TSLA with all my money,” but that’s precisely how technical analysis should be applied. This is one of the key secrets: theoretically, you should place many small, statistically advantageous bets across different instruments. Practically, this demands significant effort. Thus, it’s crucial to leverage every tool at your disposal for rapid instrument screening, trend identification, and the discovery of trading opportunities.
Context: The Elusive Key to Successful Trading
Context is the most challenging aspect of trading. If you google it, you’ll encounter countless people pushing “successful” trading systems. Many of these systems rely on the Martingale strategy, a deceptive approach that shifts risks from “high probability of losing small amounts” to “low probability of losing everything and potentially going into debt.”
Entire industries are built on this simple statistical sleight of hand. Nassim Taleb has written extensively about tail risks, shedding light on these dangers. Ignoring the fraudsters and charlatans, the general consensus is that most trading systems available online simply do not work. At best, they dissect a bullish trend into bite-sized transactions, keeping your broker happy but ultimately failing to deliver substantial gains.
The reason behind this failure is straightforward: these systems lack an understanding of context. They fail to grasp market context.
Market context is a nuanced concept; the market can be in various “moods,” “states,” and “regimes.” These elements create context. Most robotic advisors and algorithms employ primitive if-then strategies, incapable of sensing the current “mood” of the market, whether it’s a single instrument or the market as a whole. This is where technical analysis shines. The human brain, coupled with the accumulated knowledge of an experienced trader, can discern these regimes and transition between them.
This ability is visible on long-term charts but completely obscured on intraday charts. Academic literature refers to these phenomena as “regime switching” and “volatility clustering.” A prime example of understanding market context is Jeremy Irons’ monologue in the movie Margin Call (2011): “Do you care to know why I’m in this chair?” (Watch here: Margin Call Monologue).
Interestingly, context is something AI will lag behind humans in for a very long time. This partly explains why AI struggles so much with analyzing historical prices. The human capacity to interpret complex, multifaceted market signals remains unparalleled, underscoring the importance of context in successful trading.
Complexity (or rather, Simplicity)
Technical analysis encompasses trends, momentum, crowd psychology, context, and the interactions of investor groups. However, any method of analyzing these elements shouldn’t be overly canonical, strict, or precise. As mentioned in the section about fuzzy trends, the market involves too much uncertainty for rigid lines and their exact intersections with price to provide meaningful explanations.
Take Elliott Wave Theory, for instance. It’s both brilliant and overly convoluted. In my encounters, those familiar with it often obsessively count waves and corrections, debating the depth of wave B relative to wave A or wave II relative to wave I. Here’s a secret-it doesn’t matter much.
There’s too much randomness in the market. Yet, as a concept, as a grand idea, Elliott Wave Theory holds profound significance by outlining the approximate stages of major trends and roughly indicating how they begin and end. Here, the words “approximate” and “roughly” are crucial. Elliott Wave Theory is used as an example. Don’t overcomplicate things. Most elements in the trader’s artistic toolkit (triangles, squares, circles, etc.) are meaningless.
Timeframe
How many players can sway the price of a single instrument by ±10%? And how many can do so by ±0.5%? Notice the difference: the power to disrupt intraday patterns is widespread, almost anarchic. At any given moment, someone will “break the picture.” That is a certainty. But as the timeframe expands, something magical happens. Those mighty market movers dissolve into the crowd, becoming indistinguishable from the masses. In this gathering of the multitude, where few demigods remain, technical analysis finds its sanctuary.
The content and materials provided are not intended as, and should not be taken as, financial, investment, trading, or any other form of advice, nor as recommendations that have been confirmed or supported by DarkTrend or its affiliates. For more details, please refer to the Terms of Use