Vladimir Malkhanov Vladimir has a distinguished career in asset management, spanning roles at multiple asset management companies and banks. He has a deep understanding of equity, FX, fixed income, and futures markets, gained through managing mutual fund assets and client accounts. His expertise extends beyond traditional portfolio management, encompassing positions such as CEO, CIO, trader, and portfolio manager. Since 2000, he has been at the forefront of applying advanced techniques such as Time Series Analysis, frontier methods, and, since 2010, Machine Learning to improve portfolio performance and generate alpha within both asset management firms and banking institutions.

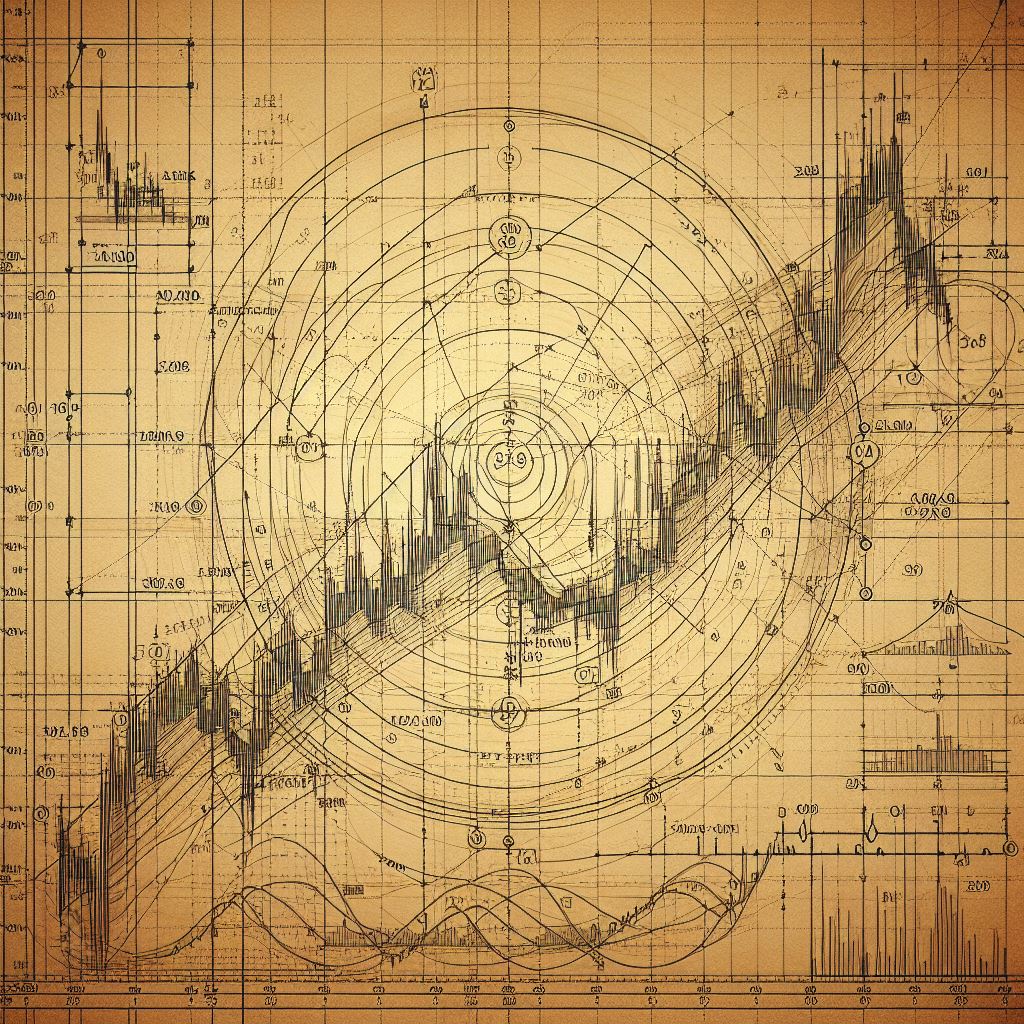
DarkTrend is a data analysis service that reveals the hidden individual price trends of financial instruments by filtering out the “noise” from broader market and sector movements. DarkTrend Screener & Explorer Built around a combination of three core principles: Hidden trends: We extract hidden trends (which we term “dark trends,” similar to dark matter) from financial time series such as stocks, ETFs, and currencies. This is achieved by filtering out correlations with other series, considering them as “noise.
The proliferation of retail platforms - those digital canvases for charting lines, squares, triangles, and loud proclamations over price charts-has turned technical analysis into a peculiar form of art: charting. Meaningless and merciless, it has captivated the hearts and souls of retail investors, who draw lines upon lines, filling social media feeds, even lifestyle Instagrams, with their creations. Today, this is what we call technical analysis. The visual appeal is understandable.

Technical analysis is a set of visual charting tools and statistical methods for price pattern and trend recognition used to predict stock and financial markets, find opportunities, and support trading decisions. When we say that technical analysis is a “set,” we imply that technical analysis as a discipline is not cohesive. It is not truly a theory. It is not a science. It is an eclectic collection of empirical methods, approaches, “theories”, and ways of forecasting prices using the price itself, or more precisely, its past history.
What is the purpose of DarkTrend.com? DarkTrend.com is a tool designed to uncover the hidden (idiosyncratic) price trends of various financial instruments (stocks, indices, ETFs and currencies). Idiosyncratic price trends refer to patterns and movements in prices that are unique to a specific instrument, rather than being driven by overarching market trends or sentiments. External market “noise” obscures these trends, making them difficult to detect. What do “noise”1 and “dark trend” mean ?
